
Last Updated on Nov 19, 2020
A pie chart (or a circle chart) is a circular statistical graphic, which is divided into slices to illustrate numerical proportions. In a pie chart, the arc length of each slice (and consequently its central angle and area), is proportional to the quantity it represents.
Pie charts are specific types of data presentation where the data is represented in the form of a circle. In a pie chart, a circle is divided into various sections or segments such that each sector or segment represents a certain proportion or percentage of the total.
In such a diagram, the total of all the given items is equated to 360 degrees and the degrees of angles, representing different items, are calculated proportionately. The entire diagram looks like a pie and its components resemble slices cut from a pie. The pie chart is used to show the break-up of one continuous variable into its component parts.
Tip: Do not waste too much time finding the correct answer. Try solving the question quickly by understanding the diagram. If you do not et the answer, eliminate some options to make an educated guesstimate.
Here is an example for better understanding.
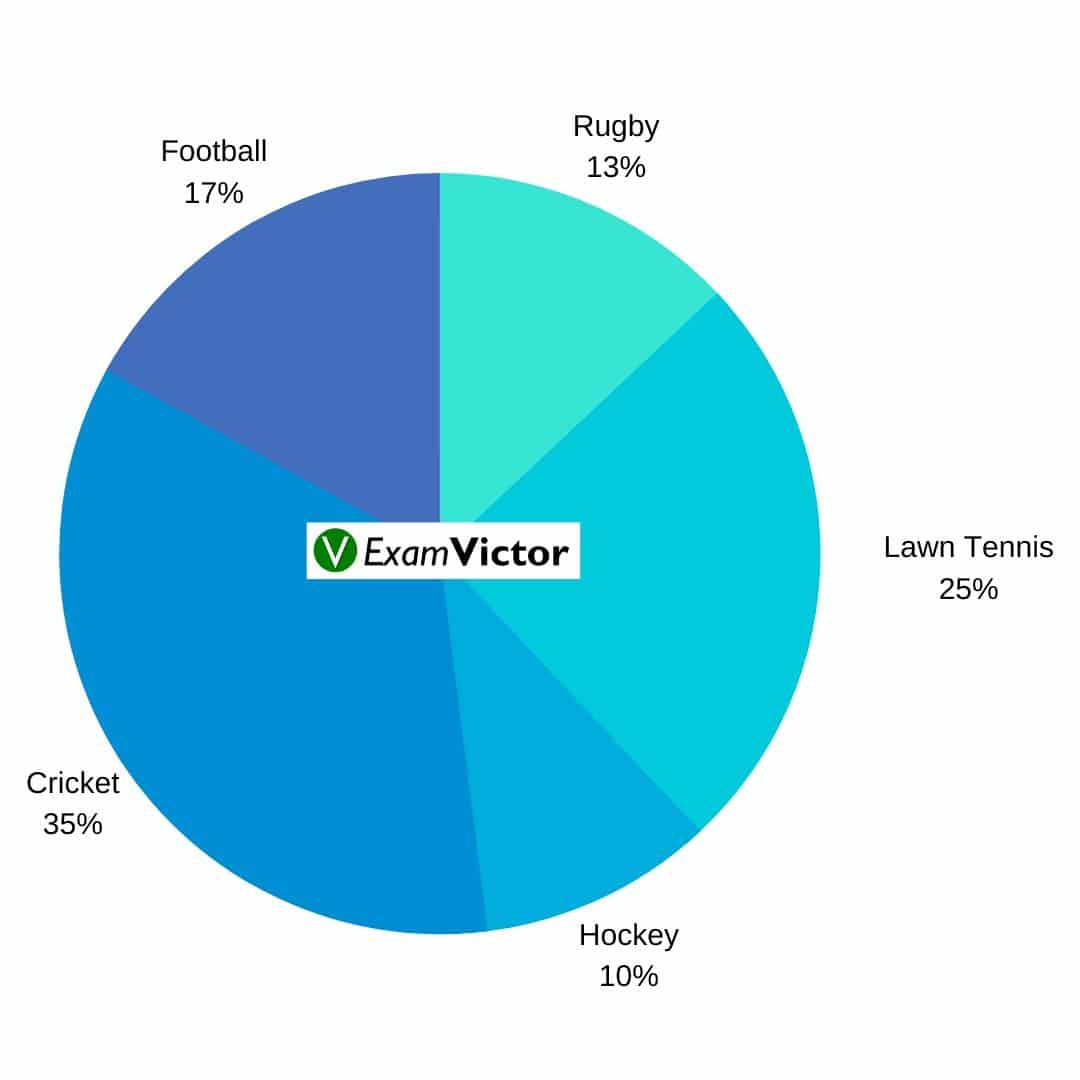 Percentage - wise distribution of players who play five different sports.
Total Players = 4200
Question: What is the total number of players who play Football and Rugby together?
- 620
- 357
- 230
- 630
- None of the above
Answer: None of the above.
Solution: Total Players = 4200
Percentage of players who play football = 17%
Percentage of players who play Rugby = 13%
Percentage of players who play both football and Rugby = 17% + 13% = 30%
Total players who play football and ruby = 30% of 4200 = 0.3* 4200 = 1260.
Tips & Tricks to Solve Pie-charts
- Start with the heading
- Do not confuse percents with numbers
- Round numbers up or down to make the calculations easier
This video lays out the basics of Pie-charts Understanding this topic well is necessary to solve questions that are asked in various competitive exams in the data interpretation section - applicable to CAT, XAT, MAT, SNAP, IIFT, CLAT, AILET, DU LLB, any other entrance exam as well.
For more such content, visit our website - examvictor.com
Hope you liked this video. Share your views in the comment section below. For more such videos click here.